Still Water, Sudden Drop: How Apparent Liquidity Vanishes the Moment You Need It Most
The Illusion Printed on Your Screen
When a retail trader opens a position, the information presented on a standard brokerage platform carries an implicit promise: this stock is liquid, the spread is tight, and an exit is available whenever you need one. That promise is not always kept.
The bid-ask spread you see at 10:02 a.m. is not necessarily the spread you will encounter at 10:03 a.m. The volume displayed in the order book represents a snapshot — a single frame extracted from a film that is running at a speed no human can reliably track. In the interval between the moment you decide to sell and the moment your order reaches the market, the conditions you traded on may no longer exist.
This phenomenon — sometimes called liquidity evaporation — is not a market anomaly reserved for obscure micro-cap names. It occurs in mid-cap stocks, in sector ETFs during stress events, and occasionally in names that carry enough average daily volume to appear entirely safe on paper. Understanding why it happens, and how to read its early signals, is one of the more underappreciated disciplines in retail trading.
Why Broker Platforms Are Structurally Behind the Market
Most retail brokerage interfaces are not built to display the full complexity of a live order book. What appears as a clean bid and ask price is typically an aggregated or slightly delayed representation of what is actually available across multiple venues — exchanges, dark pools, and the internal order flow routed through the broker's own systems.
Market makers, who are responsible for providing much of the visible liquidity in individual stocks, are permitted to withdraw their quotes under certain conditions. When volatility spikes, when news breaks, or when a stock's price begins moving faster than market makers can hedge their exposure, those quotes can disappear in milliseconds. What remains on a retail platform may reflect conditions from a fraction of a second ago — long enough for the reality to have shifted entirely.
This structural lag is not the result of negligence. It reflects the fundamental architecture of how retail platforms aggregate and display market data. The implication, however, is significant: the liquidity you see is a representation of the recent past, not a guarantee of the present.
How Market Depth Changes Before the Spread Widens
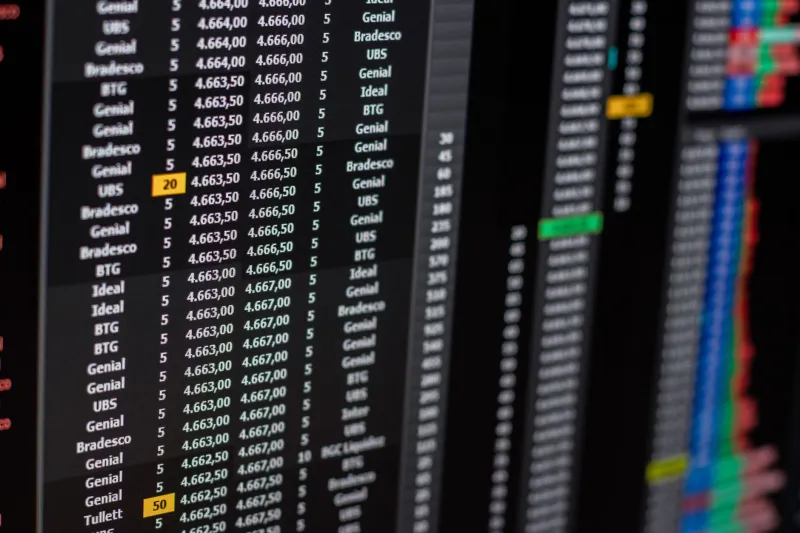
Experienced traders who monitor Level 2 data — the full order book showing bids and offers at multiple price levels — often observe a characteristic pattern before liquidity collapses visibly in the spread.
First, the depth thins. Large resting orders on both sides of the book are quietly withdrawn. The aggregate volume available within a few cents of the current price shrinks without any dramatic change in the quoted spread itself. To a trader watching only the top-of-book price, nothing appears wrong. The spread looks normal. The stock looks liquid.
Then, often triggered by a catalyst — an unexpected news item, a broader market move, a large institutional order — the remaining market makers step back simultaneously. The spread widens sharply. Bids that appeared solid moments earlier are gone. A stock that showed a $0.05 spread may suddenly display a $0.40 spread or wider. A sell order that should have executed near the mid-price instead fills at a significant discount — or, in extreme cases, triggers a trading halt.
The widening spread is not the beginning of the problem. It is the visible conclusion of a process that began earlier, in the quiet thinning of depth that most retail traders never saw.
Sectors and Conditions Where This Risk Concentrates
Liquidity evaporation is not uniformly distributed across the market. Certain conditions reliably increase the probability of encountering it.
Small and mid-cap stocks with average daily volumes that appear healthy in calm markets can become extremely difficult to exit during sector-wide selloffs. When an entire industry group moves together — biotech on an FDA decision, energy on an unexpected inventory report, regional banks during credit stress — the simultaneous pressure to exit across many names overwhelms available liquidity in each of them.
Stocks approaching binary events carry similar risk. In the hours before a major earnings release, a clinical trial result, or a regulatory ruling, market makers frequently reduce their size and widen their internal spreads to manage their own exposure. The visible spread on a retail platform may not fully reflect this withdrawal until the event itself arrives.
Thinly traded options on individual equities present an amplified version of the same problem. An options position that appeared to have a workable spread when entered can become effectively illiquid when the underlying moves sharply and market makers in the options market pull back their quotes entirely.
Early Warning Signs Worth Monitoring
While no retail trader has access to the full institutional picture, several observable signals can indicate that a stock's liquidity is becoming less reliable before the spread visibly deteriorates.
Declining order book depth on Level 2. If you have access to Level 2 data, watch not just the quoted spread but the total volume resting within a reasonable price range of the current price. A progressive decline in that aggregate depth — even when the spread itself appears stable — is worth noting.
Unusual spread behavior at market open or close. The first and last fifteen minutes of the trading session are structurally thinner than mid-day. A stock that already shows elevated spreads during these periods in calm conditions is likely to see those spreads widen dramatically under stress.
Volume that is declining into a catalyst. Counterintuitively, a sharp reduction in volume ahead of a known event can signal that market participants are withdrawing rather than positioning. Lower pre-event volume often correlates with reduced depth and faster spread widening when the catalyst arrives.
Recent halt history. A stock that has been halted for volatility in the past several weeks has demonstrated that its liquidity can disappear quickly enough to trigger exchange intervention. That history does not disappear because a few calm days have followed.
Adjusting Position Sizing to Reflect Real Liquidity Risk
The most practical response to liquidity risk is not to avoid illiquid stocks entirely — for many traders, smaller and mid-cap names represent genuine opportunity. The response is to size positions in a way that reflects the true cost of exit under adverse conditions, not the cost of exit under current conditions.
A useful exercise is to ask: if this stock's spread tripled and I needed to exit half my position immediately, what would the actual execution cost be? If that number is large relative to the expected gain from the trade, the position size is likely too large for the liquidity profile of the stock.
Using limit orders rather than market orders is a standard recommendation that carries particular weight in thinner names. A market order during a liquidity event will find the best available price — which may be far worse than expected. A limit order defines the acceptable price and protects against filling into a temporarily distorted spread, at the cost of potentially not executing at all.
The Broker's Platform Is a Tool, Not a Guarantee
Retail trading platforms have improved dramatically over the past decade. Real-time data, fractional shares, and commission-free execution have genuinely lowered barriers for individual investors. But the sophistication of the interface should not be mistaken for a guarantee of execution quality.
The liquidity displayed on your screen is a best-available representation of a market that moves faster than any retail platform can fully capture. The bid and ask you see are invitations, not commitments. In calm conditions, the gap between representation and reality is small enough to be irrelevant. In stressed conditions, that gap can be the difference between a planned exit and an unplanned loss.
Trading with that understanding — treating displayed liquidity as an approximation rather than a certainty — is not pessimism. It is the kind of precision that separates traders who survive difficult markets from those who are perpetually surprised by them.